
The Auto Trend Channels binary options indicator for the MetaTrader 4 platform is a unique trading tool that can automatically determine trend channels on various timeframes. With its help, it is easy to determine a bullish trend, indicated on the chart by green lines, and a bearish trend by red ones.
The Auto Trend Channels binary options indicator is recommended for both beginners and experienced traders. It is adapted to different trading styles, including scalping, day trading and swing trading. Suitable for all timeframes, currency pairs and cryptocurrencies, it is conveniently located on the chart, and its settings are easy to change according to your preferences. Feel free to experiment, adjusting this free technical analysis tool to your individual needs.
Content:
- Characteristics;
- Installation;
- Overview and Settings;
- Trading Rules for Auto Trend Channels;
- Opening a Call Option;
- Opening a Put Option;
- Conclusion;
- Download Auto Trend Channels.
Characteristics of the Indicator for Binary Options Auto Trend Channels
- Terminal: MetaTrader 4
- Timeframe: M15
- Expiration: 3-5 candles;
- Option Types: Call/Put
- Indicators: AutoTrendChannels.ex4
- Trading instruments: currency pairs, commodities, cryptocurrencies, stocks
- Trading hours: 8:00 - 20:00 Moscow time
- Recommended brokers: Quotex, Pocket Option, Alpari, Binarium
Installing the Auto Trend Channels Binary Options Indicator
The Auto Trend Channels indicator is installed in the MetaTrader 4 platform as standard. To do this, you need to add it to the root folder of the terminal by selecting “File” in MT4 and then “Open data directory”. In the opened directory, you need to go to the “MQL4” folder and then to “Indicators”, then move all the files there. Templates are installed in the same way, but are placed in the “templates” folder. You can read the installation instructions in more detail in our video:
Review and Settings of the Indicator for Binary Options Auto Trend Channels
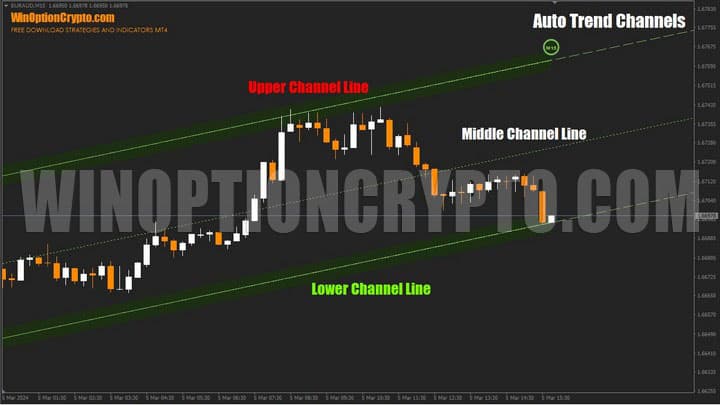
To draw a price corridor for each time frame, the Auto Trend Channels binary options indicator automatically analyzes historical data (usually the last 200 bars) and identifies several highs and lows for this period, which then become the basis for plotting its first version on the chart. Then, when prices go beyond the set range, the angle of inclination changes, maintaining parallelism of the lines.
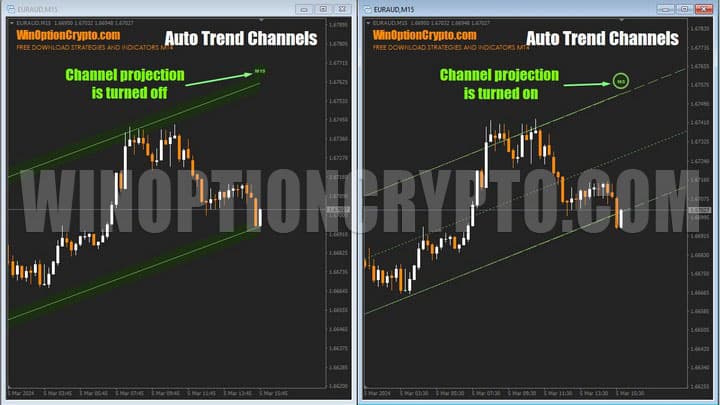
Please note that next to each channel there is a marker indicating which period it belongs to. If you click on it, the boundaries will extend into the future, demonstrating possible price dynamics.
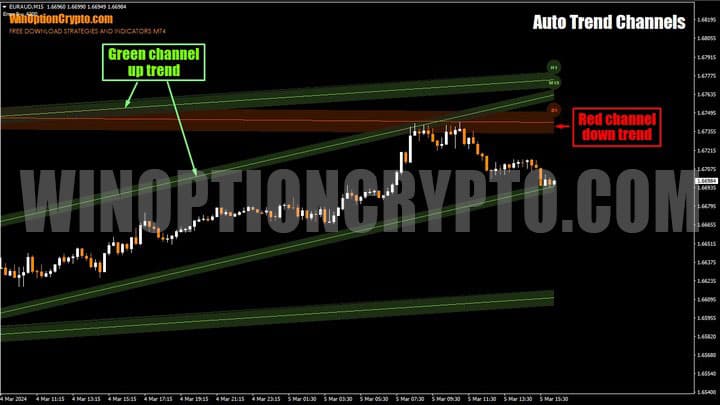
For better visual perception, the color of the lines changes depending on the direction of the exchange rate dynamics. If the trend is upward, they turn green, if downward, they turn red. In addition, the ranges of different time intervals have their own line width. The older the analyzed period, the thicker they are.
If you are just taking your first steps in binary options trading, this analytical tool will help you avoid trades against the main trend. It will indicate the dynamics of senior timeframes, which are very easy to navigate. For example, knowing where the support and resistance levels of different time periods are located, the trader will know the degree of significance of each of them, and will not get confused in determining the most promising direction of trading.

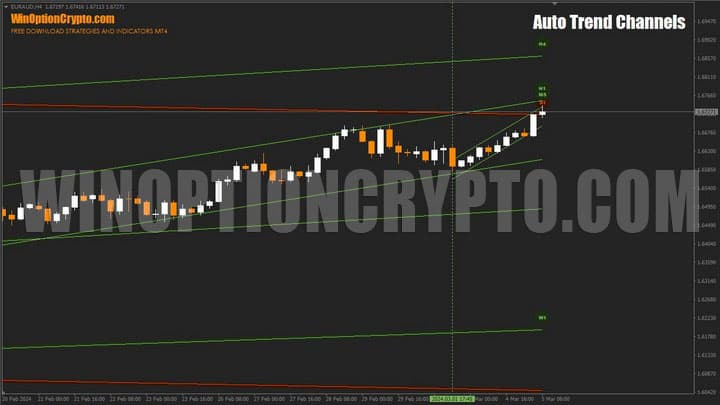
Above is an example of testing the strength of the daily range resistance level. Considering that large institutional players usually work on this time horizon, the border of the daily price corridor acts as a significant resistance on the path of 5-minute interval quotes.
As we can see, the EUR/AUD rate failed to overcome this barrier at once and the quotes of the currency pair began to drift right under this resistance. Seeing the trend lines of different periods plotted on the chart, the trader will no longer have questions: “Why did the flat occur here?” – the answer is obvious.
All that remains is to master the methods of analyzing price movements within such channels and learn how to use them in practice. We will talk about this a little later, but for now let's deal with the settings.
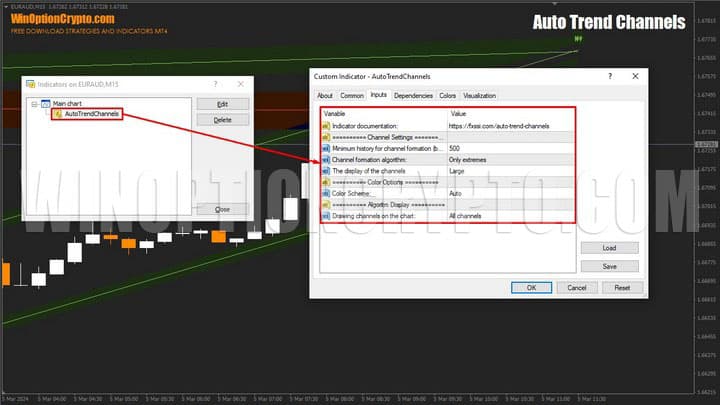
There are few settings and they are all divided into three blocks.
Channel Settings – Basic Settings
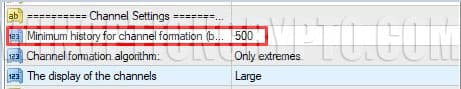
The “Minimum history for channel formation” parameter is responsible for the minimum history depth by which Auto Trend Channels is drawn. The default value is 200, but we recommend increasing it to 500.
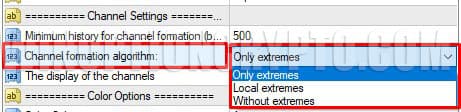
“Channel formation algorithm:” – allows you to select one of three algorithms taking into account the accuracy of the analysis of price extremes.
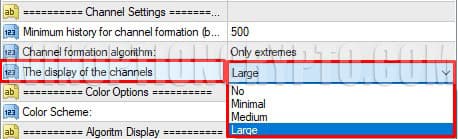
“The display of the channel” – selects one of the line display options.
Color Options – Select a Color Scheme
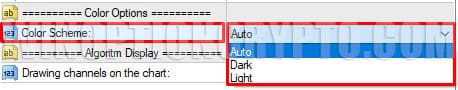
This block has only one parameter “Color Scheme” and, as the name suggests, it is responsible for the color scheme and the thickness of the lines on the chart:
- Auto – Colors are selected automatically, depending on the background of the chart
- Dark – Dark theme
- Light – Light theme
Algorithm Display – a Method of Drawing on a Graph
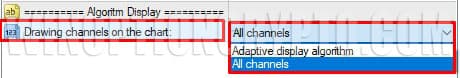
“Drawing channels on chart” allows you to select display modes:
- Adaptive display algorithm – visualization of only channels relevant for the selected period. For example, for the current H1, the following will be shown: M30, H1 and all older periods, and for the basic M5 – M1, M5 and all older ones.
- All channels – all channels for the selected timeframe will be displayed
Trading Rules for Binary Options Indicator Auto Trend Channels
The Auto Trend Channels binary options indicator can be used in trading any financial instruments. Most methods based on it are divided into two main categories:
- On a rebound from the borders
- On the breakout of the middle line
Trading on a Bounce from the Borders
By opening a position using this strategy, the trader expects the price to return inside the channel after an unsuccessful attempt to overcome its border. At this point, you can open a deal with a good profitability/risk ratio if you trade on Forex, or with a high probability of closing a binary option in the money. Let's look at a specific example.
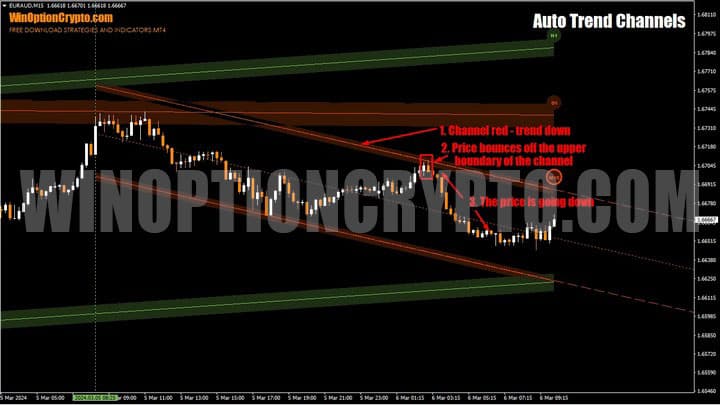
In the picture above, pay attention to the red price corridor of the M15 period. It demonstrates a clear downward trend. Therefore, transactions should be looked for exclusively for sale. In this situation, the trader needs to wait for the EUR/AUD rate to bounce off the upper border, which acts as resistance, and make a deal.
The sequence of actions for Call purchases will look like this:
- We are convinced of the presence of an upward trend - the price corridor is green
- The minimum of the current or previous candle touches the lower border
- The last bar closed higher inside
- At the opening of a new period we buy Call
For Put purchases the actions are mirrored:
- We are convinced of the presence of a downward trend, the price corridor is red
- The maximum of the current or previous candle touches the upper border
- The last bar closed lower inside
- At the opening of a new period we buy Put
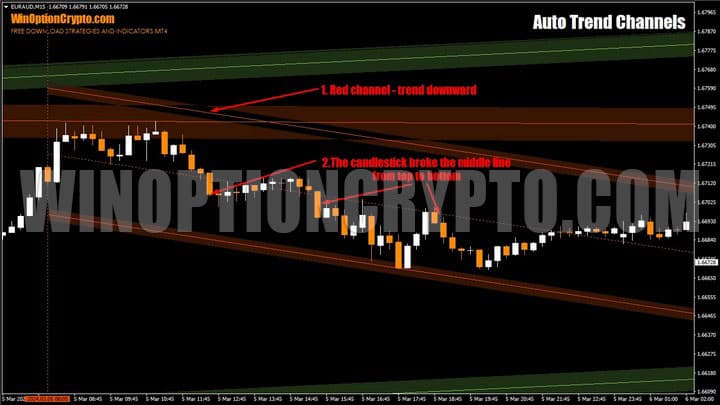
Trading on the Breakout of the Middle Line
There is another way to use this indicator - in trading on the breakout of the middle line in the direction of the dominant trend. To open a deal using this strategy, you should wait for the bar to close behind the middle line in the direction of the main trend. It is easier to navigate by color: if the indicator lines are red, we wait for the time period to close behind the middle line in the direction of the downward trend, if green, we wait for it to close behind the middle line in the direction of growth.
First, you need to decide on the direction of trading. We do this depending on the color of the price corridor: red - sales, green - purchases.
Procedure for Call:
- We make sure that there are green lines (upward trend)
- The current candle's low is below the midline and the closing price is above it (crossing from bottom to top)
- At the opening of a new period we buy a Call option
The order of actions for Put:
- We are convinced of the presence of red lines (downward trend)
- The current candle's high is above the midline and the closing price is below it (crossover from top to bottom)
- At the opening of a new period we open a buy Put
The recommended expiration time is 3-5 bars depending on the financial instrument. We recommend choosing the duration of holding positions based on the results of testing on history.
Opening a Call Option
In this example, the channel is green and the trend is upward. The minimum of the previous candle touches its lower border, and the next bar closed with an increase inward. At the opening of a new time interval, we buy Call.
Opening a Put Option
In this case, the channel is red, the trend is downwards. The minimum of the previous candle touches its upper border, and the next bar closed with a decrease inwards. At the opening of a new time interval, we buy Put.
Conclusion
The Auto Trend Channels binary options indicator is a great addition to your collection of free trading tools. It can take your trading to a whole new level and significantly increase your chances of success. However, remember the importance of realistic expectations. Like any other technical analysis tool, it does not promise 100% signal accuracy, especially in conditions of high market volatility . Do not be afraid to experiment and adapt it to your needs, creating your own trading strategies based on it. At the same time, remember that channels built on senior timeframes are usually more reliable than their short-term counterparts.
Try to avoid price consolidations and flat market areas. Start with a demo account with a trusted broker , applying all the rules of risk management and money management . And only after receiving a positive result on virtual money, proceed to trading on a real account. We wish everyone successful trading!
Download Binary Options Indicator Auto Trend Channels

To leave a comment, you must register or log in to your account.